


In July 2026, takers on Polymarket paid $412,848 for 138 million contracts priced below one cent in its World Cup winner markets. Every one of those contracts settled at zero.
In the same month, takers paid $234 for sub-cent contracts on one Angels–Giants baseball game. Those contracts paid $206,238.
Both examples come from July purchases that settled within 30 days, the window we use for returns throughout this study. They show how little a contract count alone tells a reader about the money at stake or the eventual payout. We looked across the third quarter of 2026 to measure how much buyers spent on contracts below one cent and what those purchases returned if held to settlement.
The purchases that settled within 30 days lost money in July and September, gained in August, and lost 22% over the quarter. Giving every event equal weight produces a large gain instead, though most of it disappears when we leave out events where buyers spent less than a dollar. Under either measure, the result depends heavily on a few events.
We read the Polygon logs of Polymarket’s international exchange for every block from July 1 to September 30, 2026 (UTC), covering 155,226,449 taker fills. We kept purchases below one cent at the exact price of each matched order and used the recorded settlements to calculate their payouts. Throughout the piece, “paid” includes the taker fee. The returns assume buyers held until settlement; we don’t follow wallets, so we can’t tell whether they sold earlier. (Source and method.)
Explore and download the study data.
Lots of contracts, little money
Over the quarter, takers bought 1.05 billion contracts below one cent. That is 7.7% of the 13.7 billion contracts that takers bought at any price. They paid $2.70 million for them, or 0.041% of the $6.63 billion that takers paid in all. A sub-cent contract cost about a quarter of a cent on average, fee included. The average contract at any price cost 48.5 cents.
The gap held in every month:
July: 10.1% of contracts bought, 0.055% of money paid
August: 5.2% of contracts bought, 0.026% of money paid
September: 6.0% of contracts bought, 0.034% of money paid
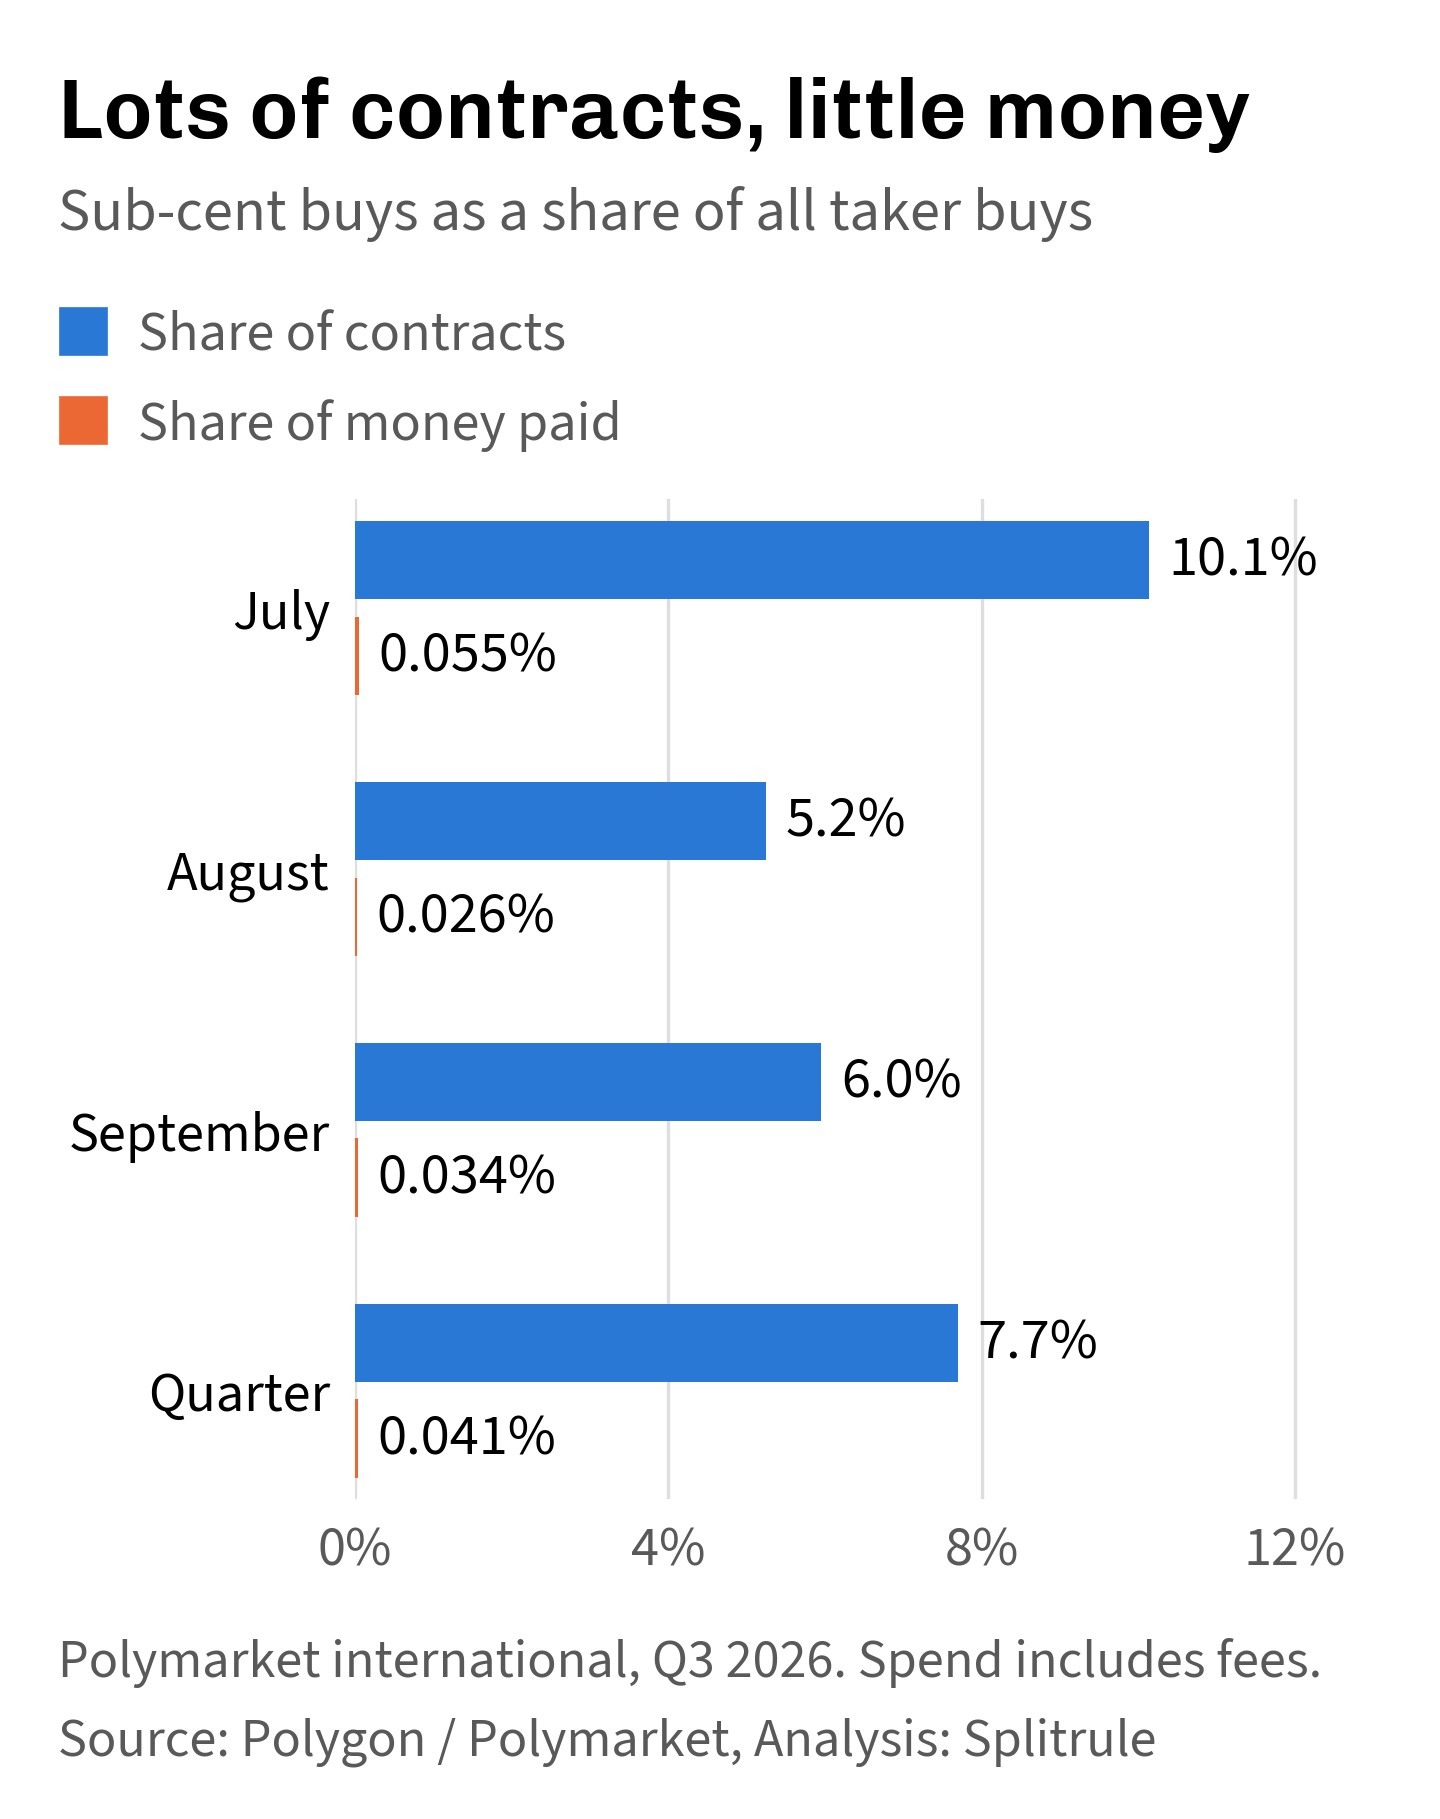
Figure 1. Below one cent, takers bought 5.2% to 10.1% of all contracts each month, but paid less than 0.06% of the money. Paid includes the taker fee. Taker buys on Polymarket’s international exchange, July to September 2026. Source: Polygon / Polymarket, Analysis: Splitrule. Values.
Across 46,221 events with sub-cent buys that settled within 30 days, half had less than $1.77 spent on those buys over the whole quarter. Most of the money was concentrated elsewhere: the 2.9% of events with $100 or more in settled sub-cent purchases accounted for 86% of the total.
So a large contract count at these prices usually stands for very little money. That matters for anything built on volume: a heat map of activity, a “most traded” list, or a claim that traders are piling into long shots.
What the money did
To calculate returns, we use purchases whose market settled on chain within 30 days of the buy. Here is how the quarter’s $2.70 million of sub-cent purchases breaks down:
81.4% settled within 30 days. Only this part enters the returns below.
17.9% ($484,639) did not settle within 30 days. By November 3, when our settlement scan ends, $105,122 of it had settled. For the other $379,517, our scan found no settlement. It includes long-dated markets such as the 2026–27 Champions League winner, which resolves in 2027.
0.65% ($17,641) was recorded after its market’s settlement in our scan. Those buys stay out by rule.
The venue’s token list lets us match every sub-cent buy to a market condition. Settlement coverage is less complete: our scan found no on-chain settlement for some markets that the venue shows as resolved. (The 30-day rule.)
By month: the share of sub-cent money settled within 30 days, the return held to payout, and its central 95% resampling range.
July: 88.0% settled, return −41.3% (range −81.6% to +47.0%)
August: 69.2% settled, return +76.7% (range −17.0% to +202.1%)
September: 74.3% settled, return −38.3% (range −71.8% to +32.2%)
Quarter: 81.4% settled, return −22.3% (range −59.8% to +45.5%)
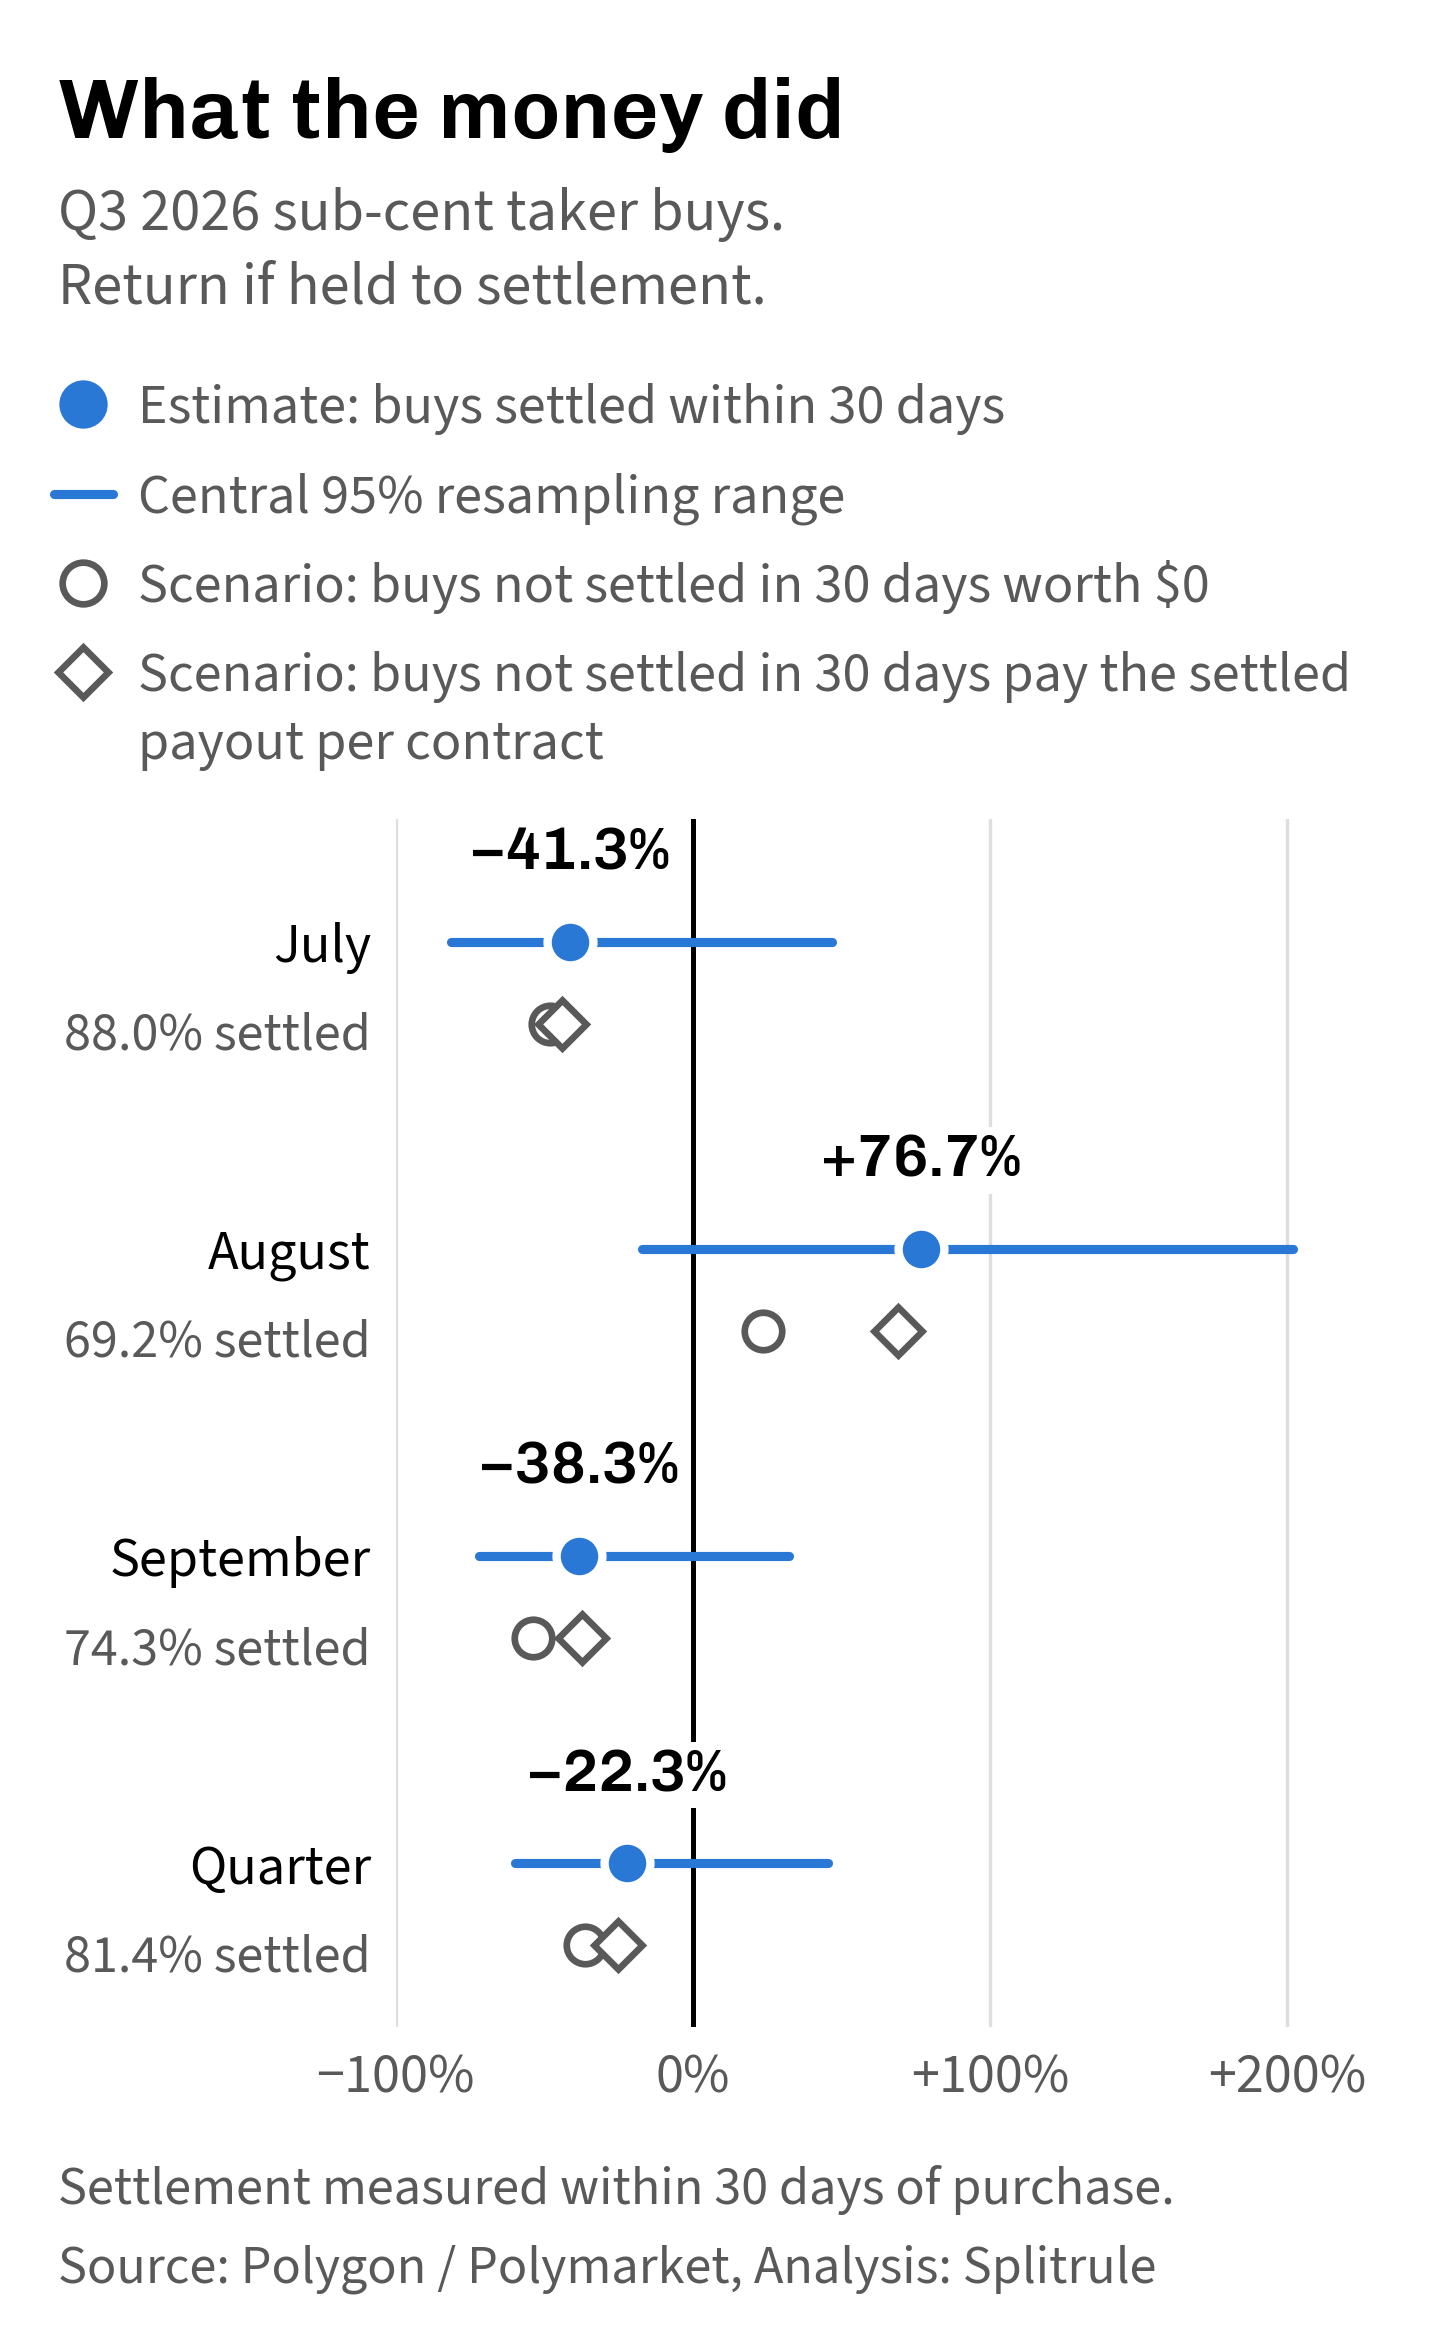
Figure 2. Held to payout, sub-cent buys settled within 30 days lost money in July and September and gained in August. Every resampling range includes zero. The hollow marks are scenarios for the buys that did not settle within 30 days: worth nothing, or paid at the settled payout per contract. Source: Polygon / Polymarket, Analysis: Splitrule. Values.
Resampling the quarter’s events produces ranges that cross zero in every case, reflecting how much the results depend on the events in the sample. The calculation treats each event as a separate draw, although markets on the same asset and day can be related. Another resampling run moves the endpoints by several percentage points. These ranges describe sensitivity to the sample; they don’t account for the study’s other limits or predict future returns. (Resampling ranges.)
We also checked how much the 30-day window affects the result. If the purchases that did not settle within 30 days are worth nothing, the quarter’s return falls to −36.3%. If they pay the same amount per contract as the settled purchases, it is −25.2%. For the quarter to break even, they must pay 3.3 times that amount per contract. August stays positive even if all of them are worth nothing.
Part of the answer is already known: the $105,122 that settled after 30 days, but by November 3, returned −51.6%. Counted in, it moves the quarter’s return to −23.6%. We keep the 30-day result as the main one, because we fixed that rule before we saw any return. (Purchases not settled in 30 days.)
Two ways to average
There is a second way to average the same purchases: give each event the same weight, whatever was spent in it. On that basis, sub-cent buying gained in every month, though July’s resampling range includes a loss.
July: −41.3% per dollar, +30.6% per event
August: +76.7% per dollar, +66.4% per event
September: −38.3% per dollar, +190.3% per event
Quarter: −22.3% per dollar, +92.8% per event
How can the same purchases lose 22% and gain 93%? Most events paid nothing: 98.9% of them over the quarter. Each of those counts as a loss of 100%. The 530 events that did pay returned, on average, 168 times what buyers spent in them. 1.15% of events times 168 gives 1.93, or a gain of 93% per event. The per-dollar figure follows the money instead. 86% of the money sat in the 1,329 events with $100 or more of sub-cent buys, and as a group they lost 31.3%. (Returns.)
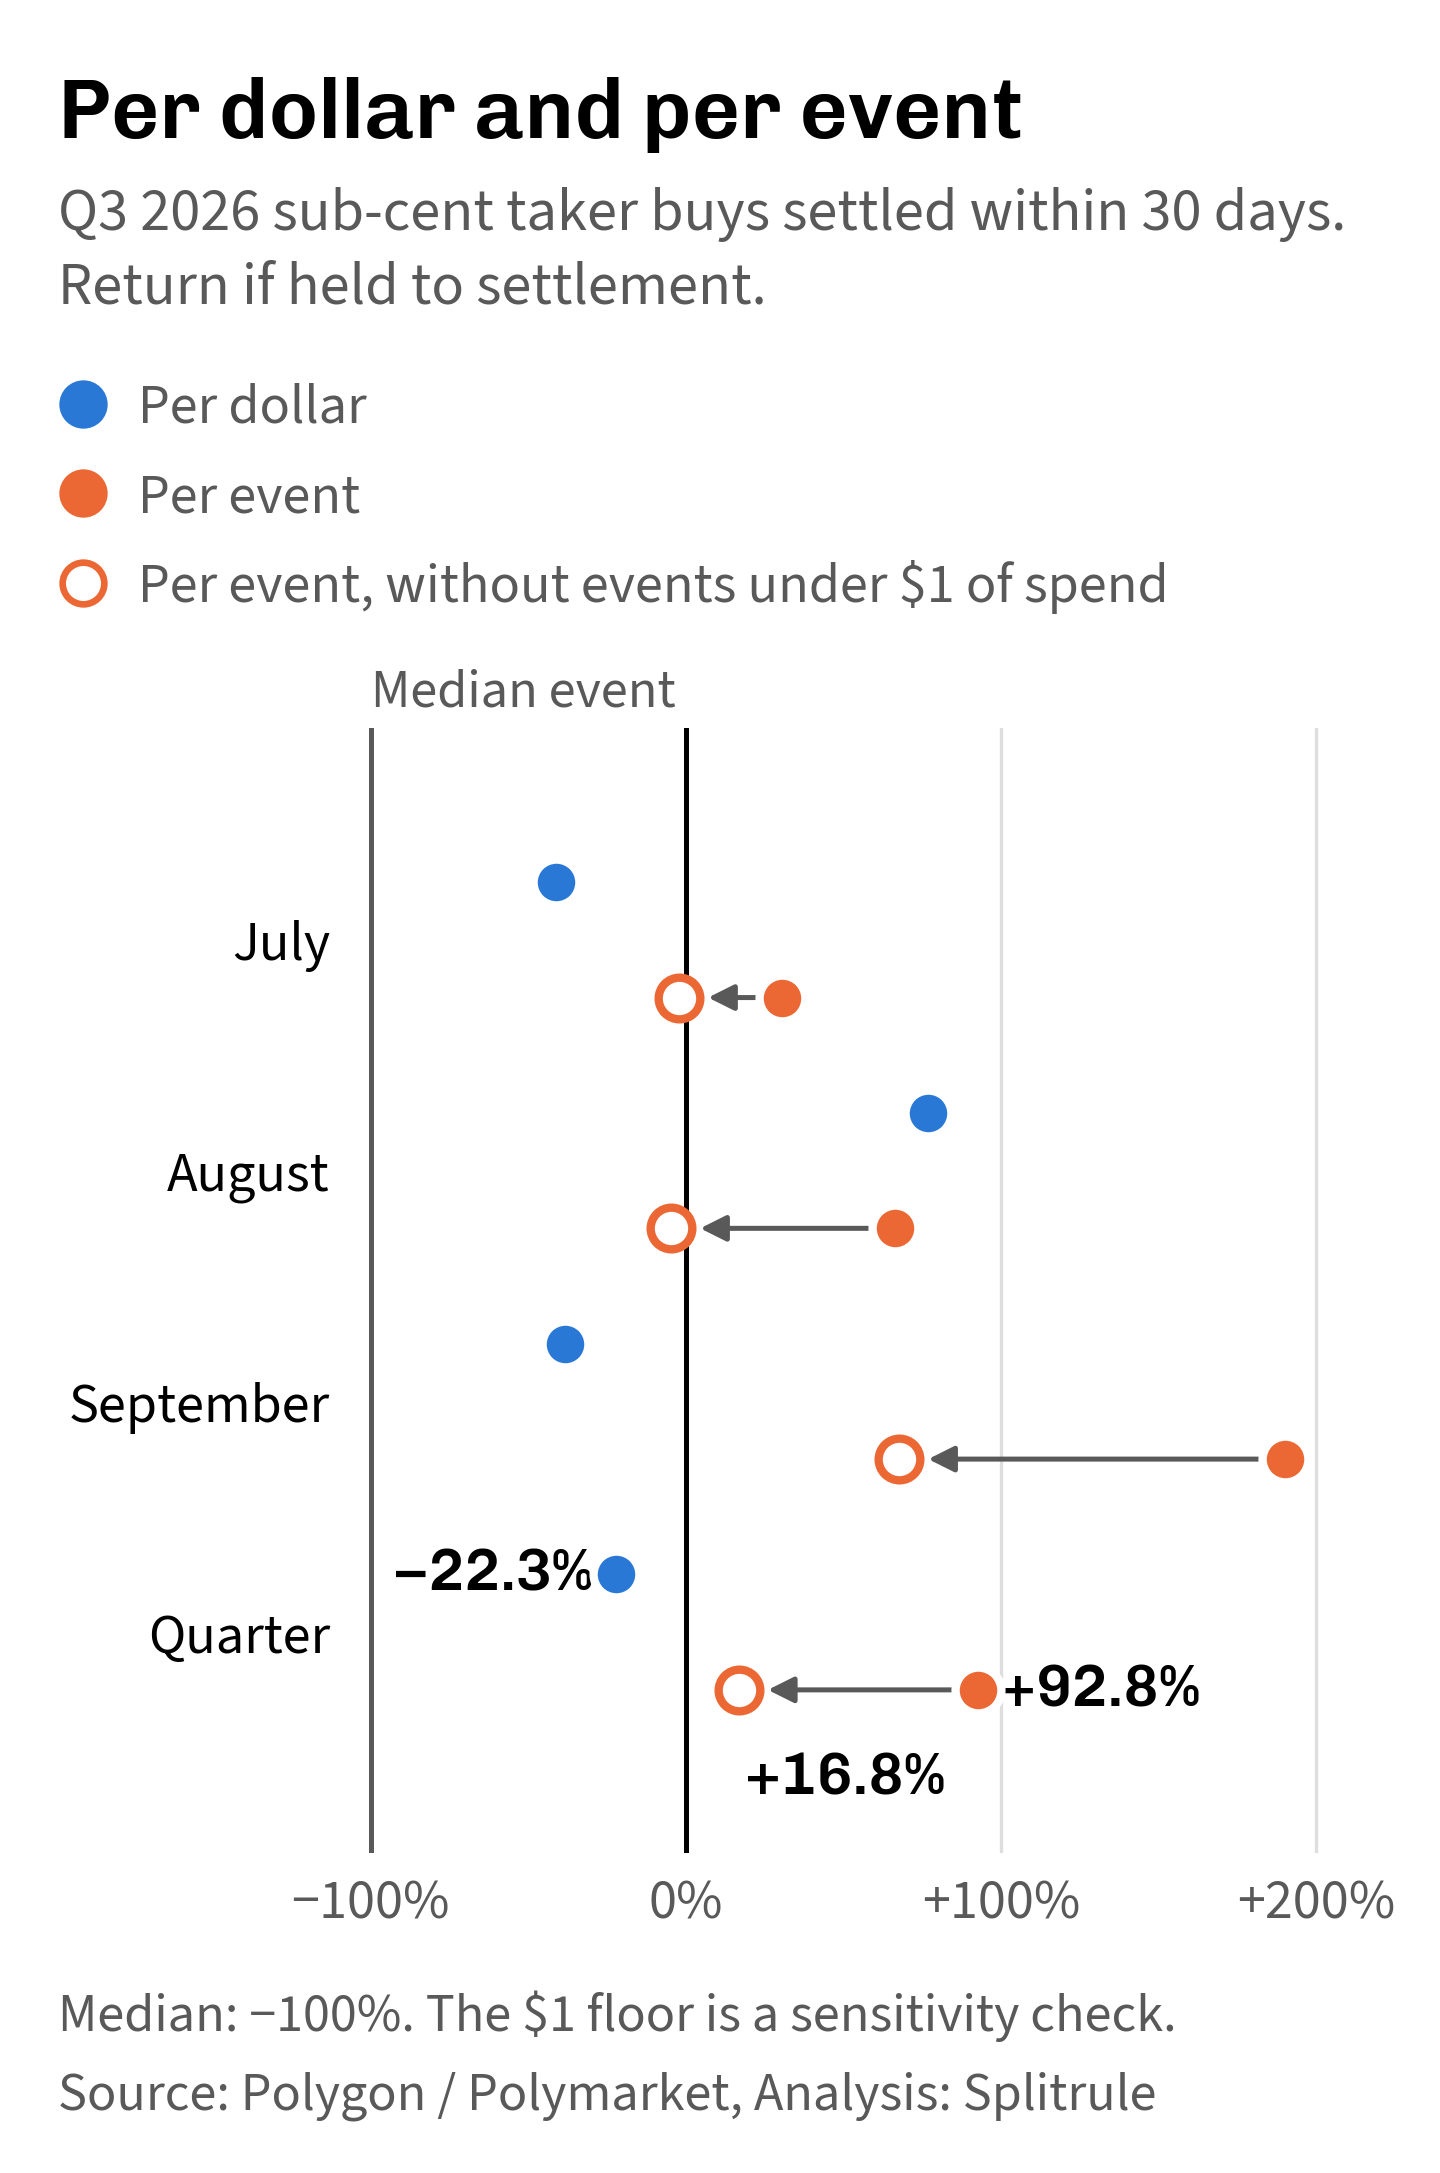
Figure 3. In July, September, and the quarter, the per-dollar and per-event returns have different signs. The per-event gain falls sharply when events with less than $1 of settled sub-cent buys are left out. We chose that floor after seeing the results, to test sensitivity. It is not a trading rule. Source: Polygon / Polymarket, Analysis: Splitrule. Values.
About a third of the events had less than $1 of settled sub-cent buys, together accounting for just 0.18% of the settled money. Yet they supplied 61% of the sum used to calculate the per-event average: each event’s payout divided by its spend. That share refers to gross payout multiples, before subtracting the purchase cost to calculate the net return. Without them, July falls to −2.1% and August to −4.7%. September falls from +190.3% to +67.7%. The per-dollar return moves by less than half a point.
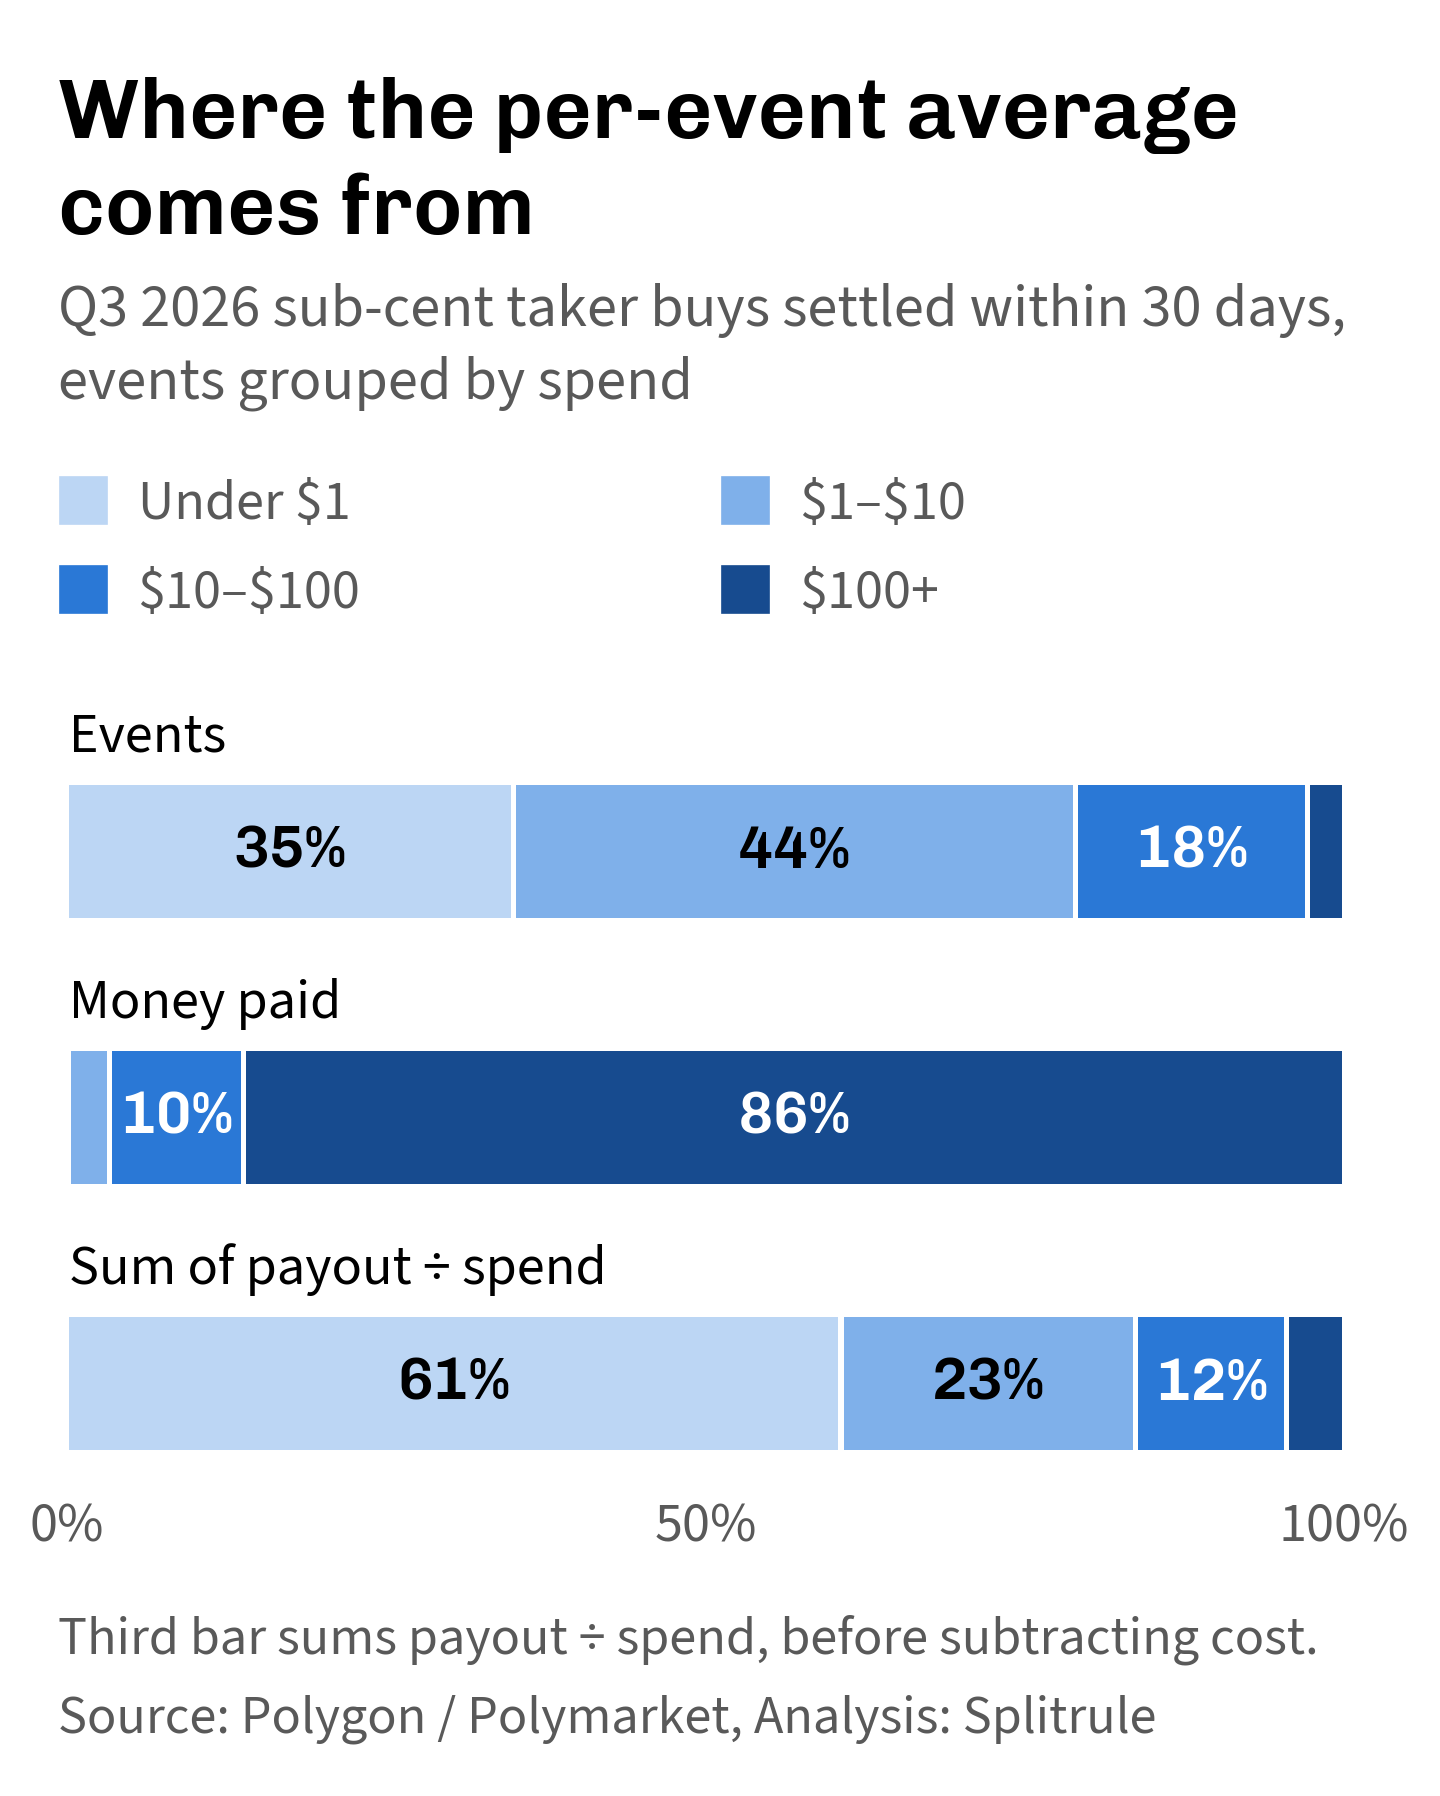
Figure 4. Events with under $1 of settled sub-cent buys were about a third of the events and almost none of the money, but most of the sum of payout multiples behind the per-event average. Events with $100 or more held most of the money. Source: Polygon / Polymarket, Analysis: Splitrule. Values.
Raise the floor further and the per-event figure swings. For the quarter, it is +49.4% when we keep only events with $10 or more of settled sub-cent buys, and +201.8% at $100 or more, on fewer events each time. The tested floors give very different averages. The typical event, the median, lost everything at every floor and in every month.
We chose these floors after seeing the results to understand the average’s sensitivity. Testing a trading rule such as “buy only where others spent more than $100” would require knowing what a buyer could observe and purchase at the time. (Spend floors.)
A few events decide the answer
Half of the quarter’s sub-cent payout came from 7 of the 46,221 settled events. In July and in August, three events held more than half of the month’s payout.
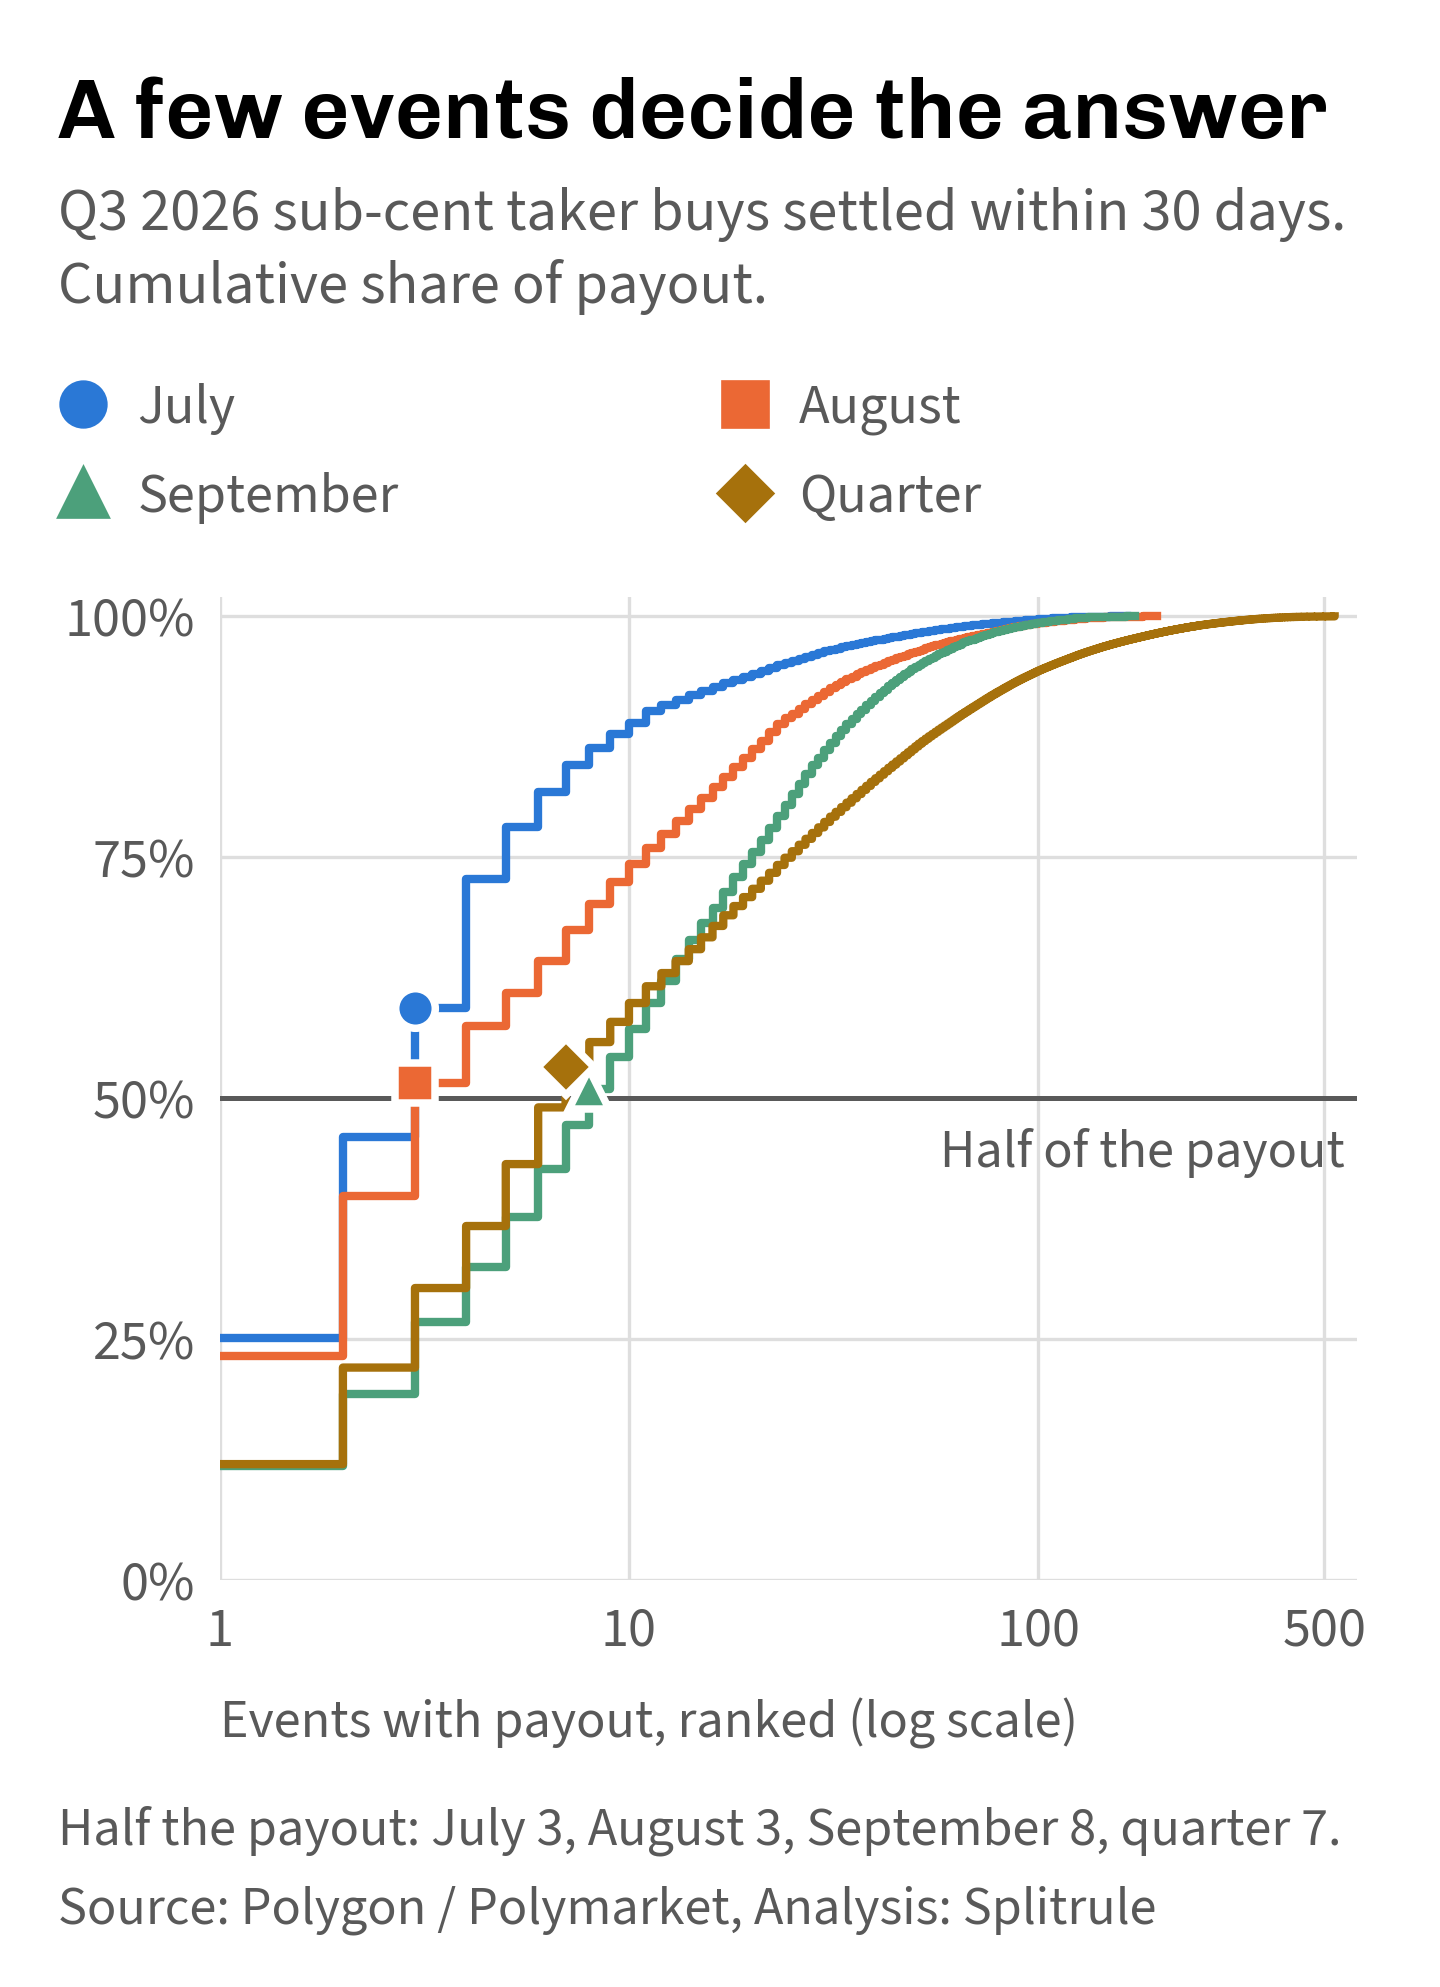
Figure 5. Half of each month’s sub-cent payout came from three to eight events, out of about 15,000 settled events a month. Source: Polygon / Polymarket, Analysis: Splitrule. Values.
The monthly results depend on those extremes. Removing each month’s three biggest winners leaves every month with a loss; removing its three biggest losers leaves every month with a gain. Those one-sided removals deliberately test the influence of the extremes. Remove the three biggest winners and the three biggest losers together, and every month keeps its sign: July −57.2%, August +7.0%, September −23.3%, and −18.0% for the quarter. (Concentration.)
The winners and losers look different. The largest payouts mostly came from small buys: the Angels–Giants game, the World Cup Golden Ball winner, a market on Bitcoin’s price on August 19, and two women’s tennis matches. The largest losses came from long shots in big events: the World Cup winner (−$412,848), the September Fed decision (−$206,160), and the July Fed decision (−$121,626). Part of that contrast comes from the loss ranking itself: an event cannot lose more than was spent in it, so the largest losses come from events with a lot of money.
The broad monthly results also hide large differences between groups of purchases. In August, the quarter’s best month, markets in the sports fee category lost 30.7%, while markets in the crypto fee category returned +360% and supplied 69% of the month’s settled payout. In July and September, both losing months, the cheapest buys, below 0.2 cents, gained 36.9% and 83.5%. That cheapest slice gained in all three months, but it rests on a few events as well. In July, three events supplied 93% of the slice’s payout. Without each month’s three biggest winners, the slice lost money in every month: −90.4% in July, −59.3% in August, and −4.9% in September. That dependence on a few winners limits what we can infer from the cheapest purchases’ three positive months.
How the markets settled matters as well. In September, 34.6% of the settled payout came from markets whose proposed result was disputed at least once before it settled, according to the venue’s record. Markets that settled 50-50 supplied 14.3%, almost all of it from markets that were also disputed. A 50-50 settlement pays half a dollar per contract on either side, giving even the long-shot side a payout. Without both groups, September’s return is −59.6% instead of −38.3%, and the cheapest slice lost 27.8% instead of gaining 83.5%. In July and August, the two groups held 2.6% and 1.4% of the settled payout. For the quarter, the return moves from −22.3% to −22.8%. The dispute record establishes that someone challenged a proposed result. Whether the final result was wrong, or what a buyer knew, remains outside this evidence. (Settlement history.)
Sidebar: did late buyers drive the result?
Some markets turn on a fixed moment, such as a crypto price at a set minute. For those markets, we could find buys recorded on chain after that moment and before the settlement was recorded. These purchases accounted for 1.3% of the settled sub-cent money. Their block times record when trades reached the chain, after an unknown delay from matching off chain. They lost 98.3% in July and 99.4% in August. In September, one market changed the picture: in the Solana Up or Down market for 6 AM ET on September 16, $22.80 of such buys paid $21,231. The venue’s record shows that a proposed result for this market was disputed before it settled. Removing every such buy moves the quarter’s return by less than one point.
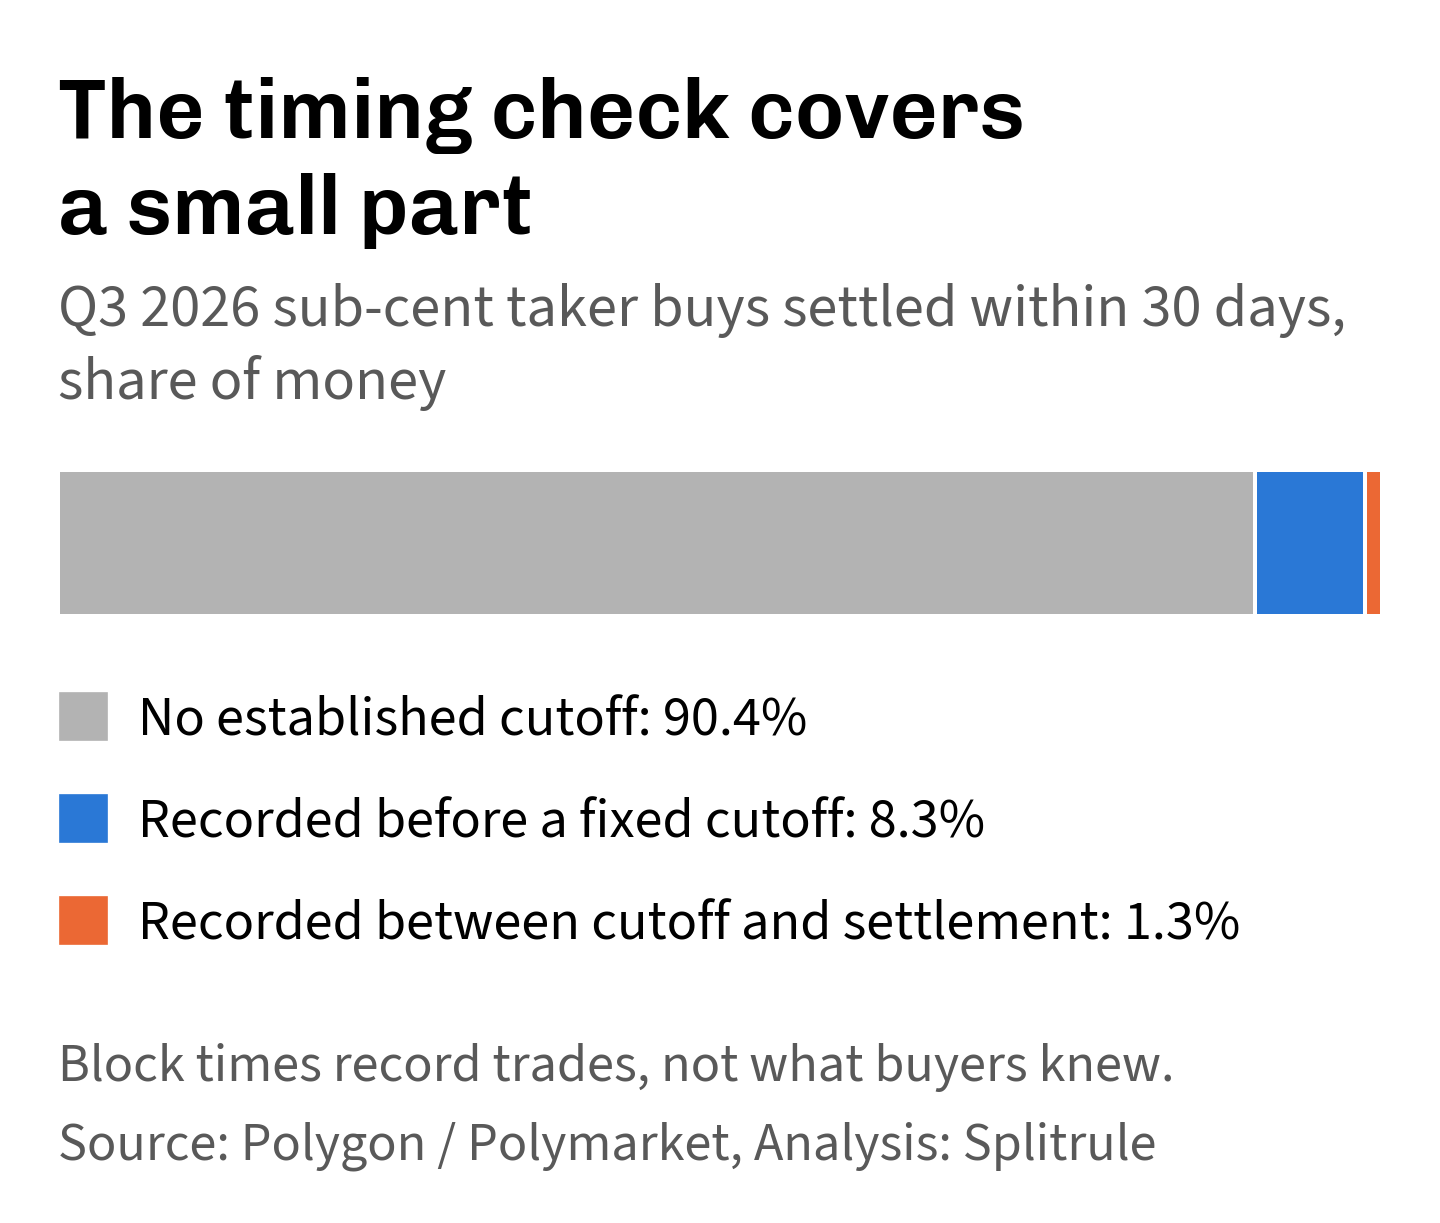
Figure 6. We could test buys recorded on chain after a fixed cutoff for only 9.6% of the settled money. Those buys were 1.3% of it. The remaining 90.4% has no established cutoff. Block times record arrival on chain; matching times and buyer knowledge remain unknown. Source: Polygon / Polymarket, Analysis: Splitrule. Values.
Among the markets without an established cutoff were the Angels–Giants game and a women’s tennis match, two of July’s three biggest payouts. In both, every settled sub-cent buy reached the chain less than an hour before the recorded settlement. Without the matching times or a fixed cutoff, this timing check cannot classify those trades. (Timing check.)
What to ask of a cheap-contract claim
Ask for dollars as well as contracts. Below one cent, 7.7% of the contracts were 0.041% of the money.
Ask which average. Per dollar, the quarter lost 22%. Per event, it gained 93%. The median event lost everything.
Ask how many events carry it. Without the three biggest winners, every month loses money. Without the three biggest losers, every month gains.
Ask how the markets settled. In September, 34.6% of the settled payout came from markets with a disputed proposal, and 14.3% from 50-50 settlements.
Ask what is left out. About 18% of the sub-cent money had not settled within 30 days, and for 14%, our scan found no settlement by November 3.
Ask whether the fills were there for you. A held-to-payout return describes fills that other buyers already took. It does not show what a new order can buy at that price.
The difference between contract counts and dollars runs down to individual fills: 94.5% of the taker fills with sub-cent buys spent less than $1 on them, together accounting for only 4.1% of the sub-cent money. Before treating a large count as a signal, a reader needs to know how much was spent, how the markets settled, and which events produced the payout. This quarter shows how much those details can change the answer.